COVID++
Fred & AVIZ team
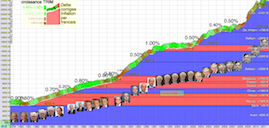
Visualization of Covid19 pandemia
smoothed curves + vertical truth
smoothed curves + real curves
colored halos + dashed line for prediction
on 2 dataset
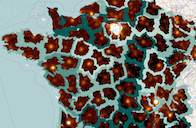
confirmed cases & death count country by country
detailed by region on important countries using JHU dataset
visiGoT
Fred &, Camille Guinaudeau
Aman Berhe
Visualization of Game Of Thrones narrative
Adjacency Matrix
Character Appearances Timelines
Enhanced Gapchart of cumulative screen time
on 2 dataset
full 7 seasons from Jeffrey Lancaster
first 2 seasons from Aman Berhe
Academic elections
by category
Fred
Visualization of Paris-Saclay Elections 2020
College / CA-CA-CFVU matrix
Bar charts on elected individuals
Color legend
on 1 dataset
Paris-Saclay Elections 2020
popChart
Fred &
Lonni Besançon
popCharts represent statistics AND population on the same map
3D + Choropleth
dot maps
heatmaps
rectangle maps
on 3 dataset
Italian linguistic data
Swedish sociologic data
French unemployement
Cushion Maps
Fred &
Lonni Besançon
Administrative hierarchical map of France
Pays = France
Regions
Départements
Sous-Préfecture
Communes
on 1 dataset
France
rankvis4
Fred, Gil Francopoulo,
Patrick Paroubek &
Joseph Mariani
gapChart of keywords in the Speech recognition domain
Pan & Zoom
Selection & coloring
on 1 dataset
keywords extracted with LIMSI tools
VoroMap
Fred
3D Map construction using a raw set of points(lon, lat, alt), a shapefile, and category or quantitative data per point
Pan & Zoom
Translation
Departements vs population
on 1 dataset
french communes
StripMap
Fred
Jean-Daniel Fekete
Multiple scalar fields aggregated in strips and represented as stack graphs
Pan & Zoom
Strip rotation & Translation
stack graphs of the 5 main candidates
on 1 dataset
French 2017 presidential election
Heatmap
multiplexing
Fred
Jean-Daniel Fekete
Pierre Dragicevic
Multiple heatmap multiplexing
Regular / irregular weaving compared to small multiple with coordinated cursors
Hexagons / strips / squares / concentric circles and many other shapes
Interactive or animated techniques when possible
on 2+ datasets
Diseases epidemy map of france from Reseau Sentinelle
NewYork taxi maps (green cabs vs yellow cabs vs Uber + pickup & drop off)
Many artificial datasets
Atlas des
langues regionales
Fred
Philippe Boula de Mareüil
Albert Rillard
Voronoi Tesselation from historic poll points
Manual correction
New poll with sound recording of peoples speaking their own regional language
Manual text translation and editing
on 2 datasets
Philippe Boula de Mareüil Poll
ALF Poll
Event
TimeVisu
Fred
Xavier Tannier
Event detection, visualisation and comparizon
Keyword(s) related event detection
Smoothing and local maxima detection
Braided graph to compare and Image illustration of events
on 2 datasets
Online Newspaper crawling
A.F.P. (french press agency)
Exploded
Heatmap
Fred
Exploded heatmap of France by departement
Standard heatmap
Split by administrative areas
Zoomed individually according to importance
on 2 datasets
Dynamic queries
Demographic & economic values
French language pronunciation
Fluid
Mechanics
Fred
Jalel Chergui
Fluid Mechanics Scalar Field Visualization
Standard heatmap
Discrete landmarks with on-the-fly contour lines
Interactive baseline with double color scale
Shading with gradient of scalar field and angular field orientation
Shading with simplex texture on rotanional vector components to expose vortices
on 2 datasets
Von Kármán vortex street simulation run at LIMSI-CNRS
Real-time Lattice Boltzmann fluid simulation
Horizon
Maps
Fred
Charles Perin
Continuous Scalar Field Visualization
Standard heatmap
Discrete landmarks with on-the-fly contour lines
Interactive baseline with double color scale
Shading with gradient of scalar field
on 1 dataset
Public transport density on Paris Area
RER + subway + tramway + bus
Multivariate
Visualization
3 standard multivariate demos
simple scatterplot matrix + animated SP
parallel coordinates + coloring
attribute explorer + multiple ranges
on 5 classic datasets
120 river streams in Oregon
407 old cars
78 cereal nutrition facts
1039 digital cameras
150 iris flowers
StratumGraph:
Interactive Horizon Graphs
Fred
Charles Perin
Jean-Daniel Fekete
Split Time series - 4 graph techniques
Silhouette Graphs
Horizon Graphs (Interactive)
Banded Silhouette Graphs (AKA 2 tones pseudo coloring)
Stratum Graphs (new)
on 3 datasets
Real-time Weather station network: 8 graphs
Stock market: S&P100 = 100 graphs
US states unemployement evolution : 50 graphs
BiSlider
Web widget to embed in any web page
Range Slider
Colored histogram background
Multiple range
Multitouch
on 1 dataset
HSB & RGB hitogram of digital picture
many example of possible sliders
h-View
Fred
Stephanie Buisine
UIST h-index
Computation of h-index with google Scholar
Visualization of square NxN inside hyperbolic pyramid
on 1 dataset
Visualization of the whole UIST h-index in 2007 (for 20th anniversary)
Politik
Visualization
Cumulative Debt by governements
French debt, unemployment related to political evolution
President / 1rst minister
on 1 dataset
Additional Debt by President or 1rst minister
French debt, unemployment related to political evolution
Normalization by GDP and by population
GapChart: Ranking
visualization
Fred
Charles Perin
Jeremy Boy
Hybrid RankChart-SlopeGraph to distinguish equalities in ranking over time
SlopeGraph / Rankchart
Vertical gap relative to relative scores
Horizontal sizes relative to absolute scores
on 4 dataset
ISCA top keywords
Soccer league 1 result for 2012-2013
Olympic medals ranking
ARWU Shanghai university ranking
Early Map
heatmap
Heatmap design
Additive functions
3 possibles distances
proportional contributions
on 1 dataset
France population density
Number
Abundancy
Number Layout in 2d space with hexa tiling
Prime numbers, abundant/deficient numbers, perfect numbers
3 possibles layout (hexa spiral, pyramid, )
on 1 dataset
Integers !
Parent
Fred
Laurence Nigay
A Treemaps application with stairs
Wide rectangles shapes (optimized for labels)
Interactive stair shape to relate element under mouse cursor to hierarchy elements
Nested indented lists on demands where treemaps get messy
on 1 dataset
File hierarchy
FiCell
Fisheye Spreadsheet
Fred
Laurence Nigay
A spreadsheet application with very small cells and multiple foci fisheyes
Different fisheye shapes
Fisheye colision morphing
Visible link between cells in focus anf cells away from focus
on 1 dataset
EDF bakeries electricity usage