GapChart: hybrid visualization technique to follow gaps in ranking
Charles Perin, Jeremy Boy and Fred Vernier
Sport datasets
French football / Soccer: Ligue1
last 7 years (current year in high res)
last 33 years (low res. no shading)
FIFA ranking
May 2002 - May 2014
European championships
major 5 championships 2013-2014
4 Nordic champioships 2013
Ligue 1
Premier League
Liga
Bundesliga 1
Serie A
5 Major leagues
Ligue 1
Premier League
Multiple metrics (affluence, uncertainty, etc.)
Rugby
last 9 Top14 (current year in high res)
Olympic Games
1948 - 2012
French Basket PropA
2013
Tour de France
2014
Academic datasets
CHI papers per countries
last 3 years
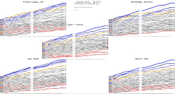
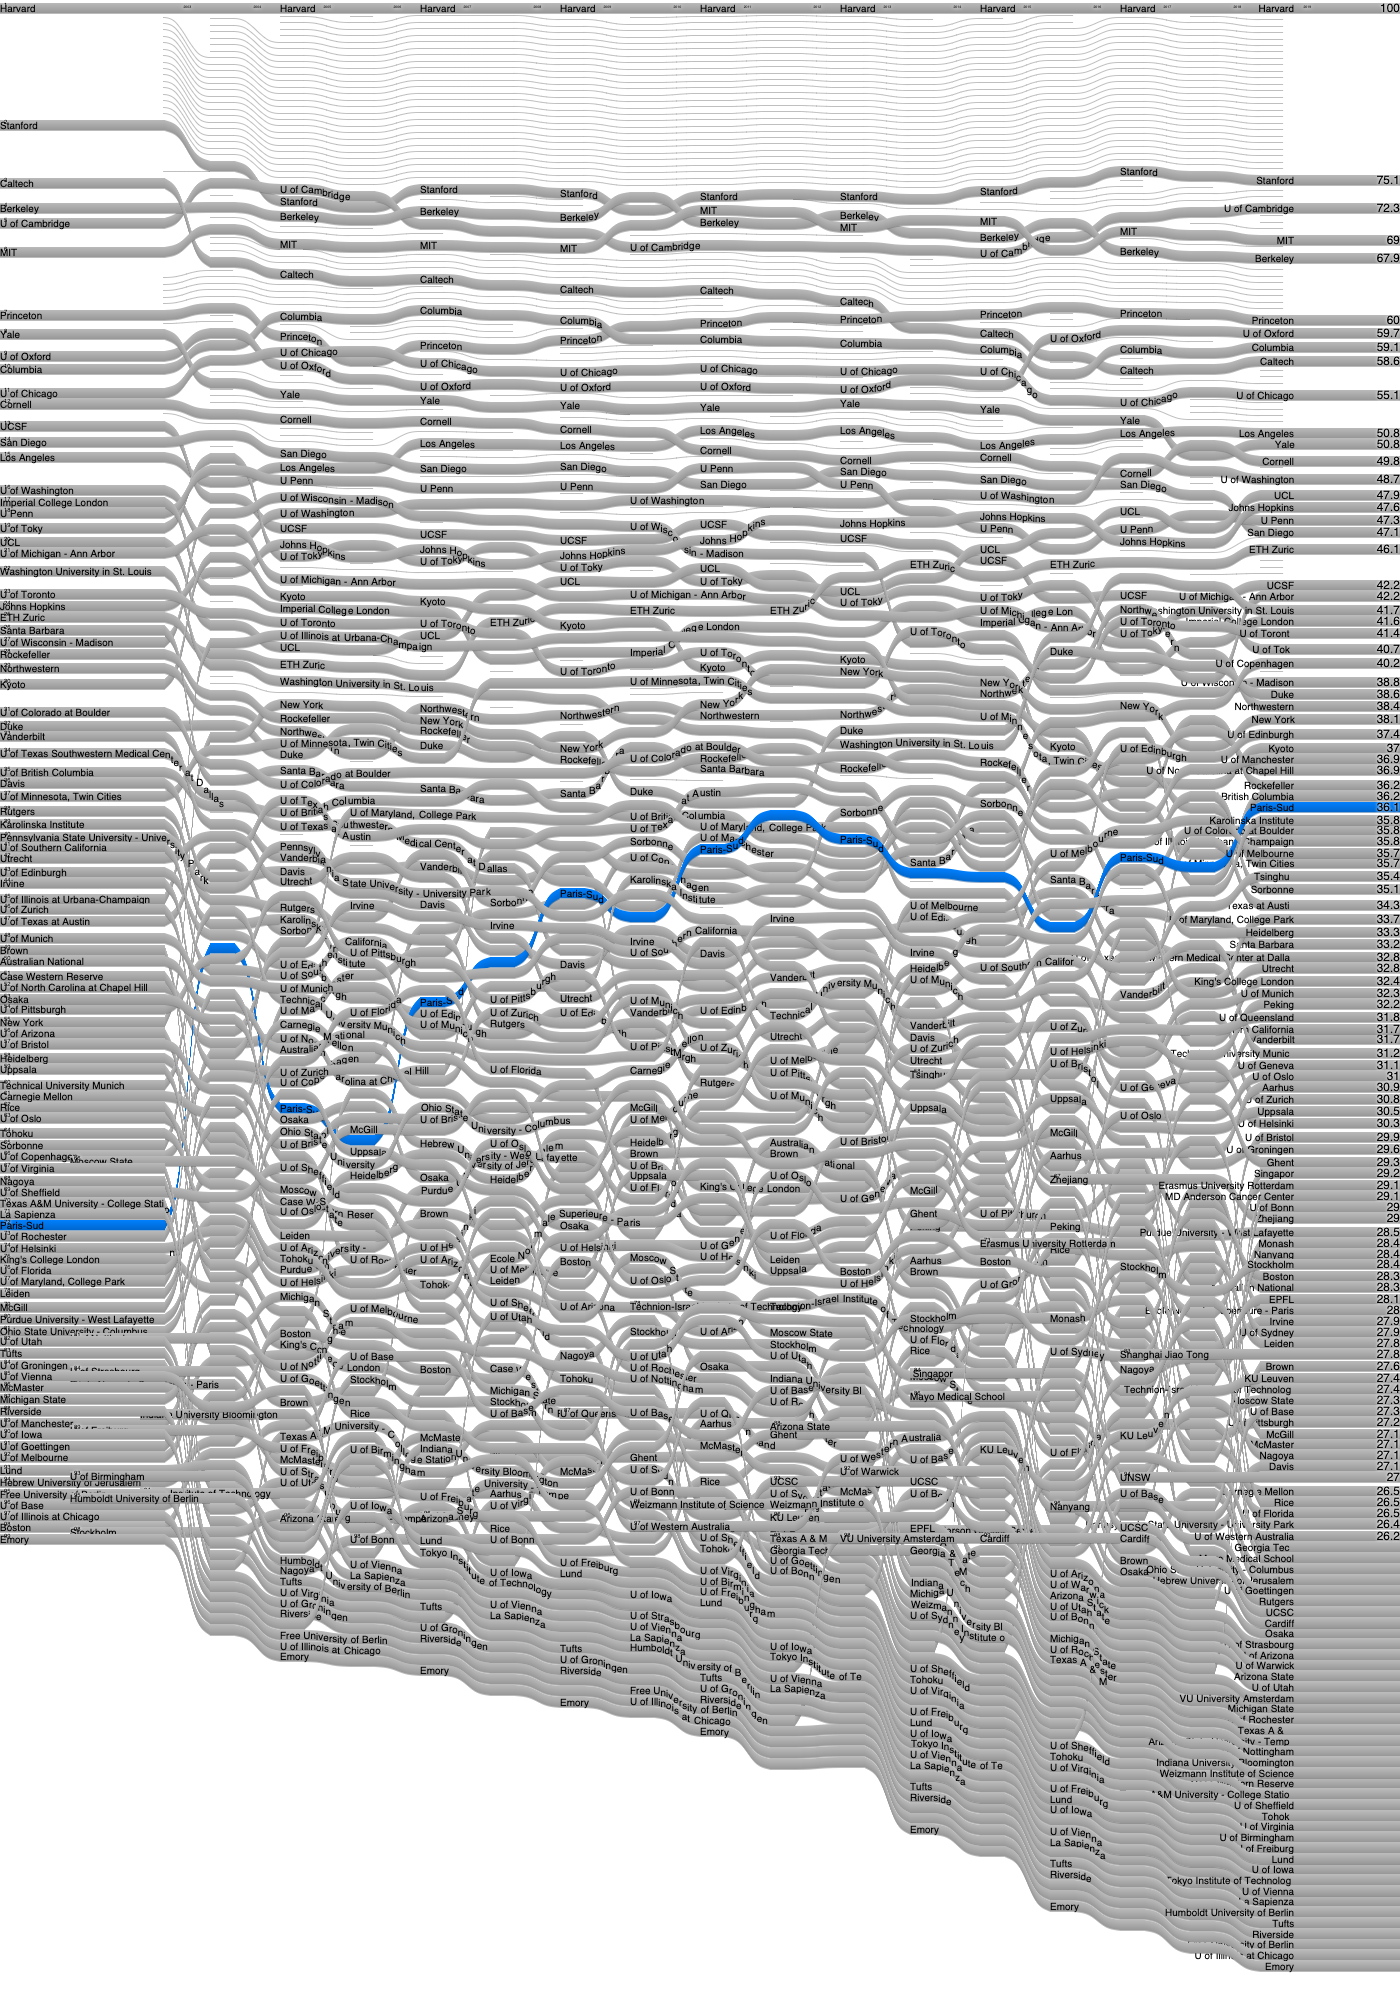
ARWU Shanghai University ranking
2003-2019
keyword popularity in
ISCA conference proceedings
1995-2011
Economic&Democratic datasets
Network Readiness Index
2002-2014
Fortune 500. US companies
2002-2013
House of Representatives per state over the years
1789-2010
Raw datasets
We've gathered most data from internet, convert them to csv file(s) and fix as many errors we could. You think you can better visualize it ? use different colors ? compute a better index to visualize ? download the
free data
and send us feedbacks


 Ligue 1
 Premier League
 Liga
Liga Bundesliga 1
 Serie A