General
La même page en Français à propos de FieldMaps
A java applet can be tested here.
FieldMaps The algorithm was called FieldMaps by analogy to agriculture fields seen from the sky.
FieldMaps is inspired from the Nested Treemaps proposed by Brian Johnson and Ben Shneiderman. You can
jump from my page to the TreeMaps Page because a lot
of others great works runs about Treemaps.
FieldMaps are a little bit different to Nested TreeMaps or Squarified TreeMaps. In FieldMaps any element can
be optimized to tend to an ideal shape. This shape can be the square (like squarified TreeMaps) or a shape optimized
for displaying labels on it (horizontal rectangle with a ratio Height/Width= 1/5).
The FieldMaps algorithm uses an evaluation function to compare the different possible solutions with the ideal shape.
The ideal shape can be different for each element (for example the shape of each image can be different in an
image database).
Screenshots


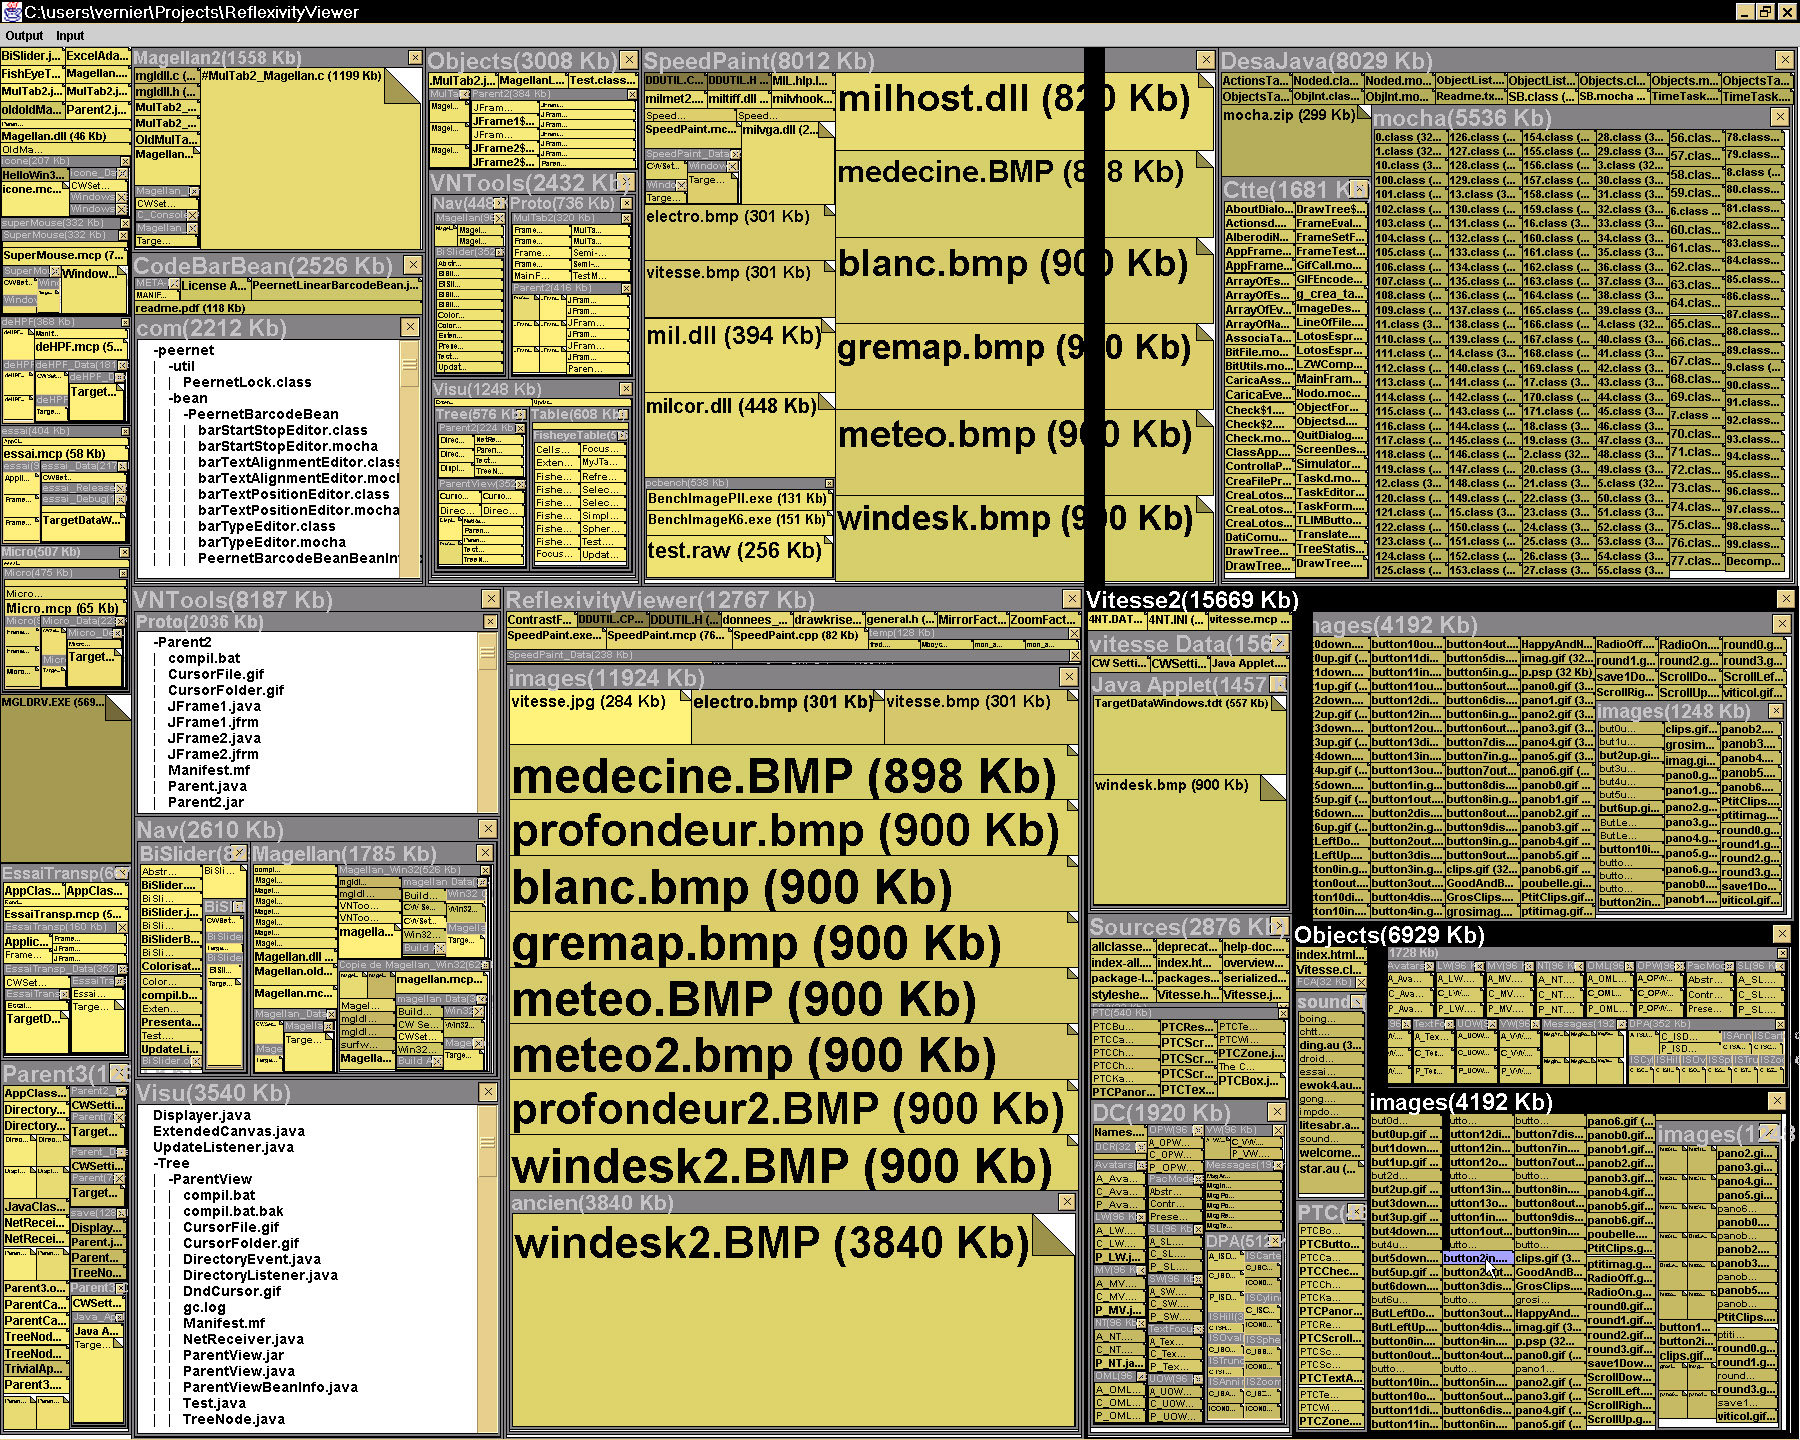
-1- FieldMaps with 1400 Files. The ratio is 1/5. Three folder are displayed using an alternative view (white background).
The black stair follows the path of the file under the mouse cursor.
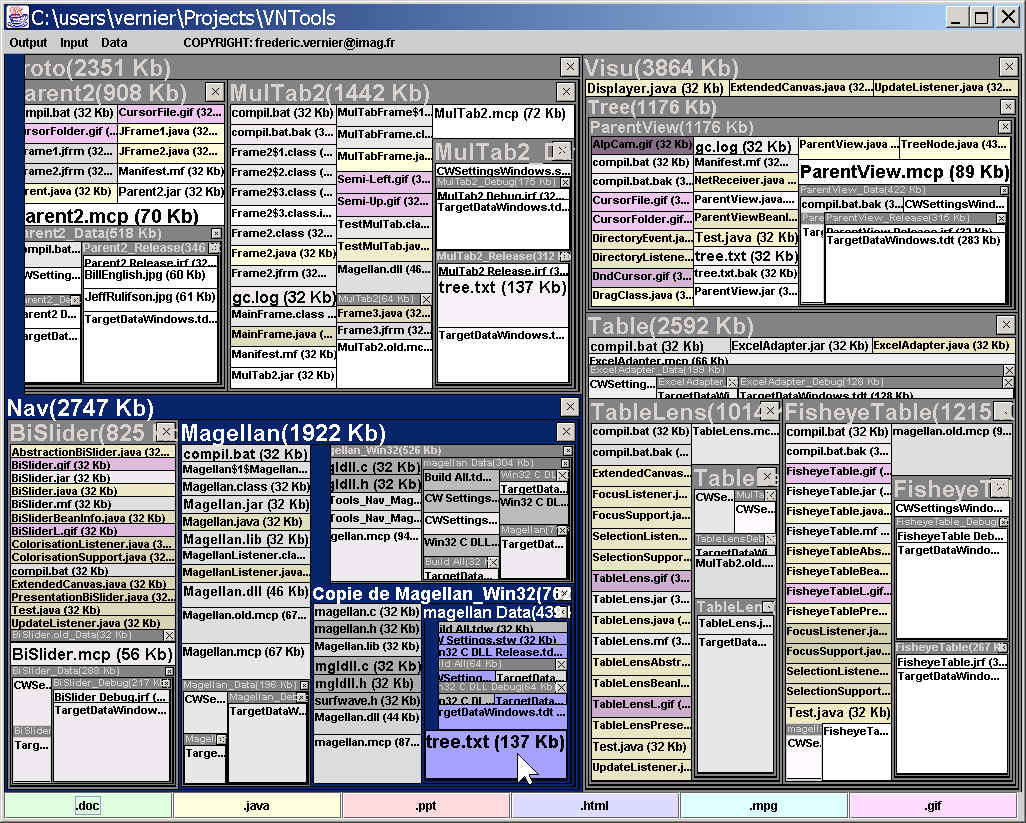
-2- FieldMaps with 240 files. The ratio is 1 (Squarification). The folder "Table" is selected in grey/blue.On the left,
the upper folder "Proto" is globally brighter than "Visu" because the files in it are more recent.
-3- FieldMaps also displays the traditional "nested TreeMaps".
-4- FieldMaps with 240 Fichiers again. ratio = 0.2. several files are selected in grey/blue. The file AlpCam.gif is th
only gif which is old. There are more Java files than Gif Files.
-5- PARENT with 750 Files. Ratio = 0.2. The same directory than Figure -4- but we added a lot of new files. I appears that
there are a lot of new Gif files and now there are more Gifs than Java Files.
Publication
A 2 pages Article "work in progress" to Visualization'2000 (IEEE Salt lake city). Pdf.
Features
The hierarchy displayed is the tree structure of computer files. Each file is represented by a rectangle (size proportional
to the disk usage) and each folder is represented by a "window".
The files are colored to represent 2 attributes : The file type and the last modification date. (Older = Darker)
Six file types (Doc, Mpg, Gif, ...) are colored with different hues. The hue toolbox has 6 buttons you can select/deselect
to activate/desactivate the colorization. The label of the button is the extension of the file type. A file can ba drag&Drop on a
button to change the file type of the button.
A black stair shows the path between the top of the file hierarchy to the file under the mouse cursor. Each subfolder
between this two elements are highlighted. If the selected element is a folder and not a file (the mouse cursor is over
a window title bar), all the files in this folder are highlighted at the same time.
For each sub folder of the hierarchy, a textual alternative view can replace the local FieldMaps algorithm.
The user can request this view when he is unable to read the labels in a small area.
The drag&drop move a file or a selection of multiples files. The move can be within the application or with
other apps. For example a file can be picked in FieldMaps and dropped on the MS-Windows Desktop. If the move takes
place into the FieldMaps View, a piano sound is played to represent the trajectory.
To do
Content of the rectangles as spreadsheet cell. Cell algebra (add, avg formulas) on hierarchy
Multiple views. Windows and MacOS X like
Reorganization animation (after a drag&drop)
Algorithm improvement (stability and special cases)
Acknowledgments
François Bérard gave me the idea of parallax I always want
to implement ... one day.
Laurence Nigay, my PhD supervisor. In particular I appreciate her help
during the writing of our common paper at Visualisation'2000.
|